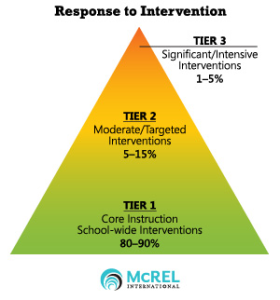
“How can we implement MTSS/RtI when we have an upside-down triangle?”

The unfortunate reality in many schools is that far less than 80 percent of students are mastering academic standards through tier 1 instruction alone. Given this predicament, how can school leaders tackle RtI implementation?
Multi-Tiered Systems of Support (MTSS), which include RtI, are built on the idea that general education instruction should meet the needs of the majority of students. When that isn’t the case, the first place to look is at the curriculum, instruction, and assessment that is happening in general education classrooms and how well these systems align with each other and with state academic standards. The next step is to review the performance and preparedness of the student body.
Disaggregating data is particularly helpful—but don’t just look at overall proficiency rates. Dig into the assessments. Can you look at subtests or subsections diagnostically to break down reading skills into decoding, fluency, identifying key ideas and details, or determining the meaning of words and phrases as they are used in text? Understanding at this level helps teachers to know that they are not responsible for re-teaching all of the previous grade level’s content; rather, they can and should focus on specific, targeted areas of need. The data should also show at what scale to design the lessons: whole class, small group, or individual level.
We know that not all students come to school with equal levels of preparation. Consider your data carefully—what does it say about your students? Do all of your kindergarteners come to school knowing their letters, numbers, and colors? Do your middle school students understand the concepts of mass, force, and motion? Can all of your 9th graders simplify quadratic equations? If not, what percentage need to learn this? If it’s greater than 20–25 percent, focus on improving tier 1 general education. If 15–20 percent are struggling, consider what interventions are available to address those needs. If fewer than 5 percent of your students are struggling, this can be an area that’s best addressed through individual problem-solving.

Knowing where to start with RtI implementation when your triangle is upside-down can be a challenge, but it’s not insurmountable. Start with your data—let it guide where to focus your energies. Here are some questions to consider:
Tier 1:
- What aspects of your core curriculum and instructional practices are addressing the needs of about 80 percent of learners, and what aspects need adjustment?
- Who in your school is best suited to tackle improvements in this area (e.g. leadership team, grade level team, content area team)?
Tier 2/3:
- Do you have certain areas where every year you know you will need interventions available (e.g. attendance, reading decoding, problem-solving)?
- Are your interventions meeting the needs of about 85 percent of the students who receiving them? Do any of your interventions need adjustments (time, frequency, group size, content)?
- Who in your school is best suited to tackle this?


I found this article to be very informative in guiding my PLC meetings throughout the year to meet the needs of all learners. It was very insightful to view the process of disseminating data to target the exact skills needed. I was left wondering, though, what do we do if too many students move to a new classroom lacking a basic skill that will help them succeed at a higher level? For example, in the fifth grade, lots of the topics revolve around basic fast facts yet a lot of students are not proficient in memorizing these facts (a third grade skill). Do I spend my time reteaching this to the whole class (more than 25% struggling) so that they can succeed in say finding volume? Or do I provide them with something like a multiplication table that will help them move on, but prevent wrong answers from basic computation?
Great question Stacey! In the example you provided, I would ask for more data. Do the students conceptually understand multiplication and division? Are they missing all of their facts, or only a few? What percentage of your class is missing the majority of the facts, vs. the percentage missing just a few? These answers help focus your next steps.
Generally speaking, we want the majority of instructional time spent on grade level expectations. Otherwise, when teachers continually re-teach previous year’s skills students are never exposed to grade level expectations and gaps widen. During time spent on grade level content, allow students to use multiplication tables or calculators. To get students up to speed, look at your daily schedule. If greater than 25% of students are grappling with conceptual understanding of multiplication, carve out time at the end of lessons to address this. Use concrete and pictorial representations before moving to the more abstract understanding of procedural math. If students conceptually understand and just need procedural practice look for short periods of downtime you can capitalize on to practice. Maybe it’s when lining up for lunch, going to specials or even while you are taking attendance–have the students play a skip counting game like Bizz Buzz. Get creative with your solutions, but always start with your data!
By the way, if you haven’t read this article about fluency in math, this one is a great read: http://www.nctm.org/News-and-Calendar/Messages-from-the-President/Archive/Linda-M_-Gojak/Fluency_-Simply-Fast-and-Accurate_-I-Think-Not!/
Author, Linda Gojak explains why fluency encompasses more than memorizing facts and procedures, and what teachers can do about it.